Podcast listener demographics: how to find out where your audience lives

Nathaniel DeSantis
Podcast Analytics

Introduction
Every sponsor deck template has a demographics slide, so every podcaster eventually goes hunting for podcast listener demographics — age, gender, income — and comes back mostly empty-handed. Here’s the uncomfortable truth: for most shows, that data barely exists.
Downloads don’t carry birthdays. What download data can tell you, reliably and without guesswork, is where your audience lives and which apps they use. That turns out to be more useful than podcasters expect.
This post covers what’s actually knowable, what’s survey-flavored guesswork, and how to put real geographic data to work.
Key takeaway
True age and gender data is mostly industry surveys or platform-siloed panels — not per-show facts
Spotify and Apple demographic data covers only their logged-in users, not your whole audience
Geography is different: it comes straight from download data and it’s reliable
Country and US-metro data drives real decisions on content, events, and sponsors
Listening-app breakdowns are the other demographic you can actually trust
Why age and gender data is mostly smoke
A podcast download is an anonymous file request. There’s no account, no profile, no age attached. So where do demographic claims come from?
Industry surveys — useful for “podcast listeners in general,” not your show specifically
Platform panels — Spotify knows its logged-in users’ profiles, but that describes only your Spotify slice
Listener surveys you run yourself — genuinely useful, but self-selected and small
Vendor estimates — often modeled from thin signals, and rarely auditable
None of this means demographic curiosity is pointless. It means any per-show age/gender number should be labeled clearly for what it is: an estimate from a partial sample. Sponsors who know the medium already understand this.
What download data actually knows: geography
Geography is the honest demographic. Download requests carry enough network information to place listeners by country — and in the US, by metro area — without profiling anyone.
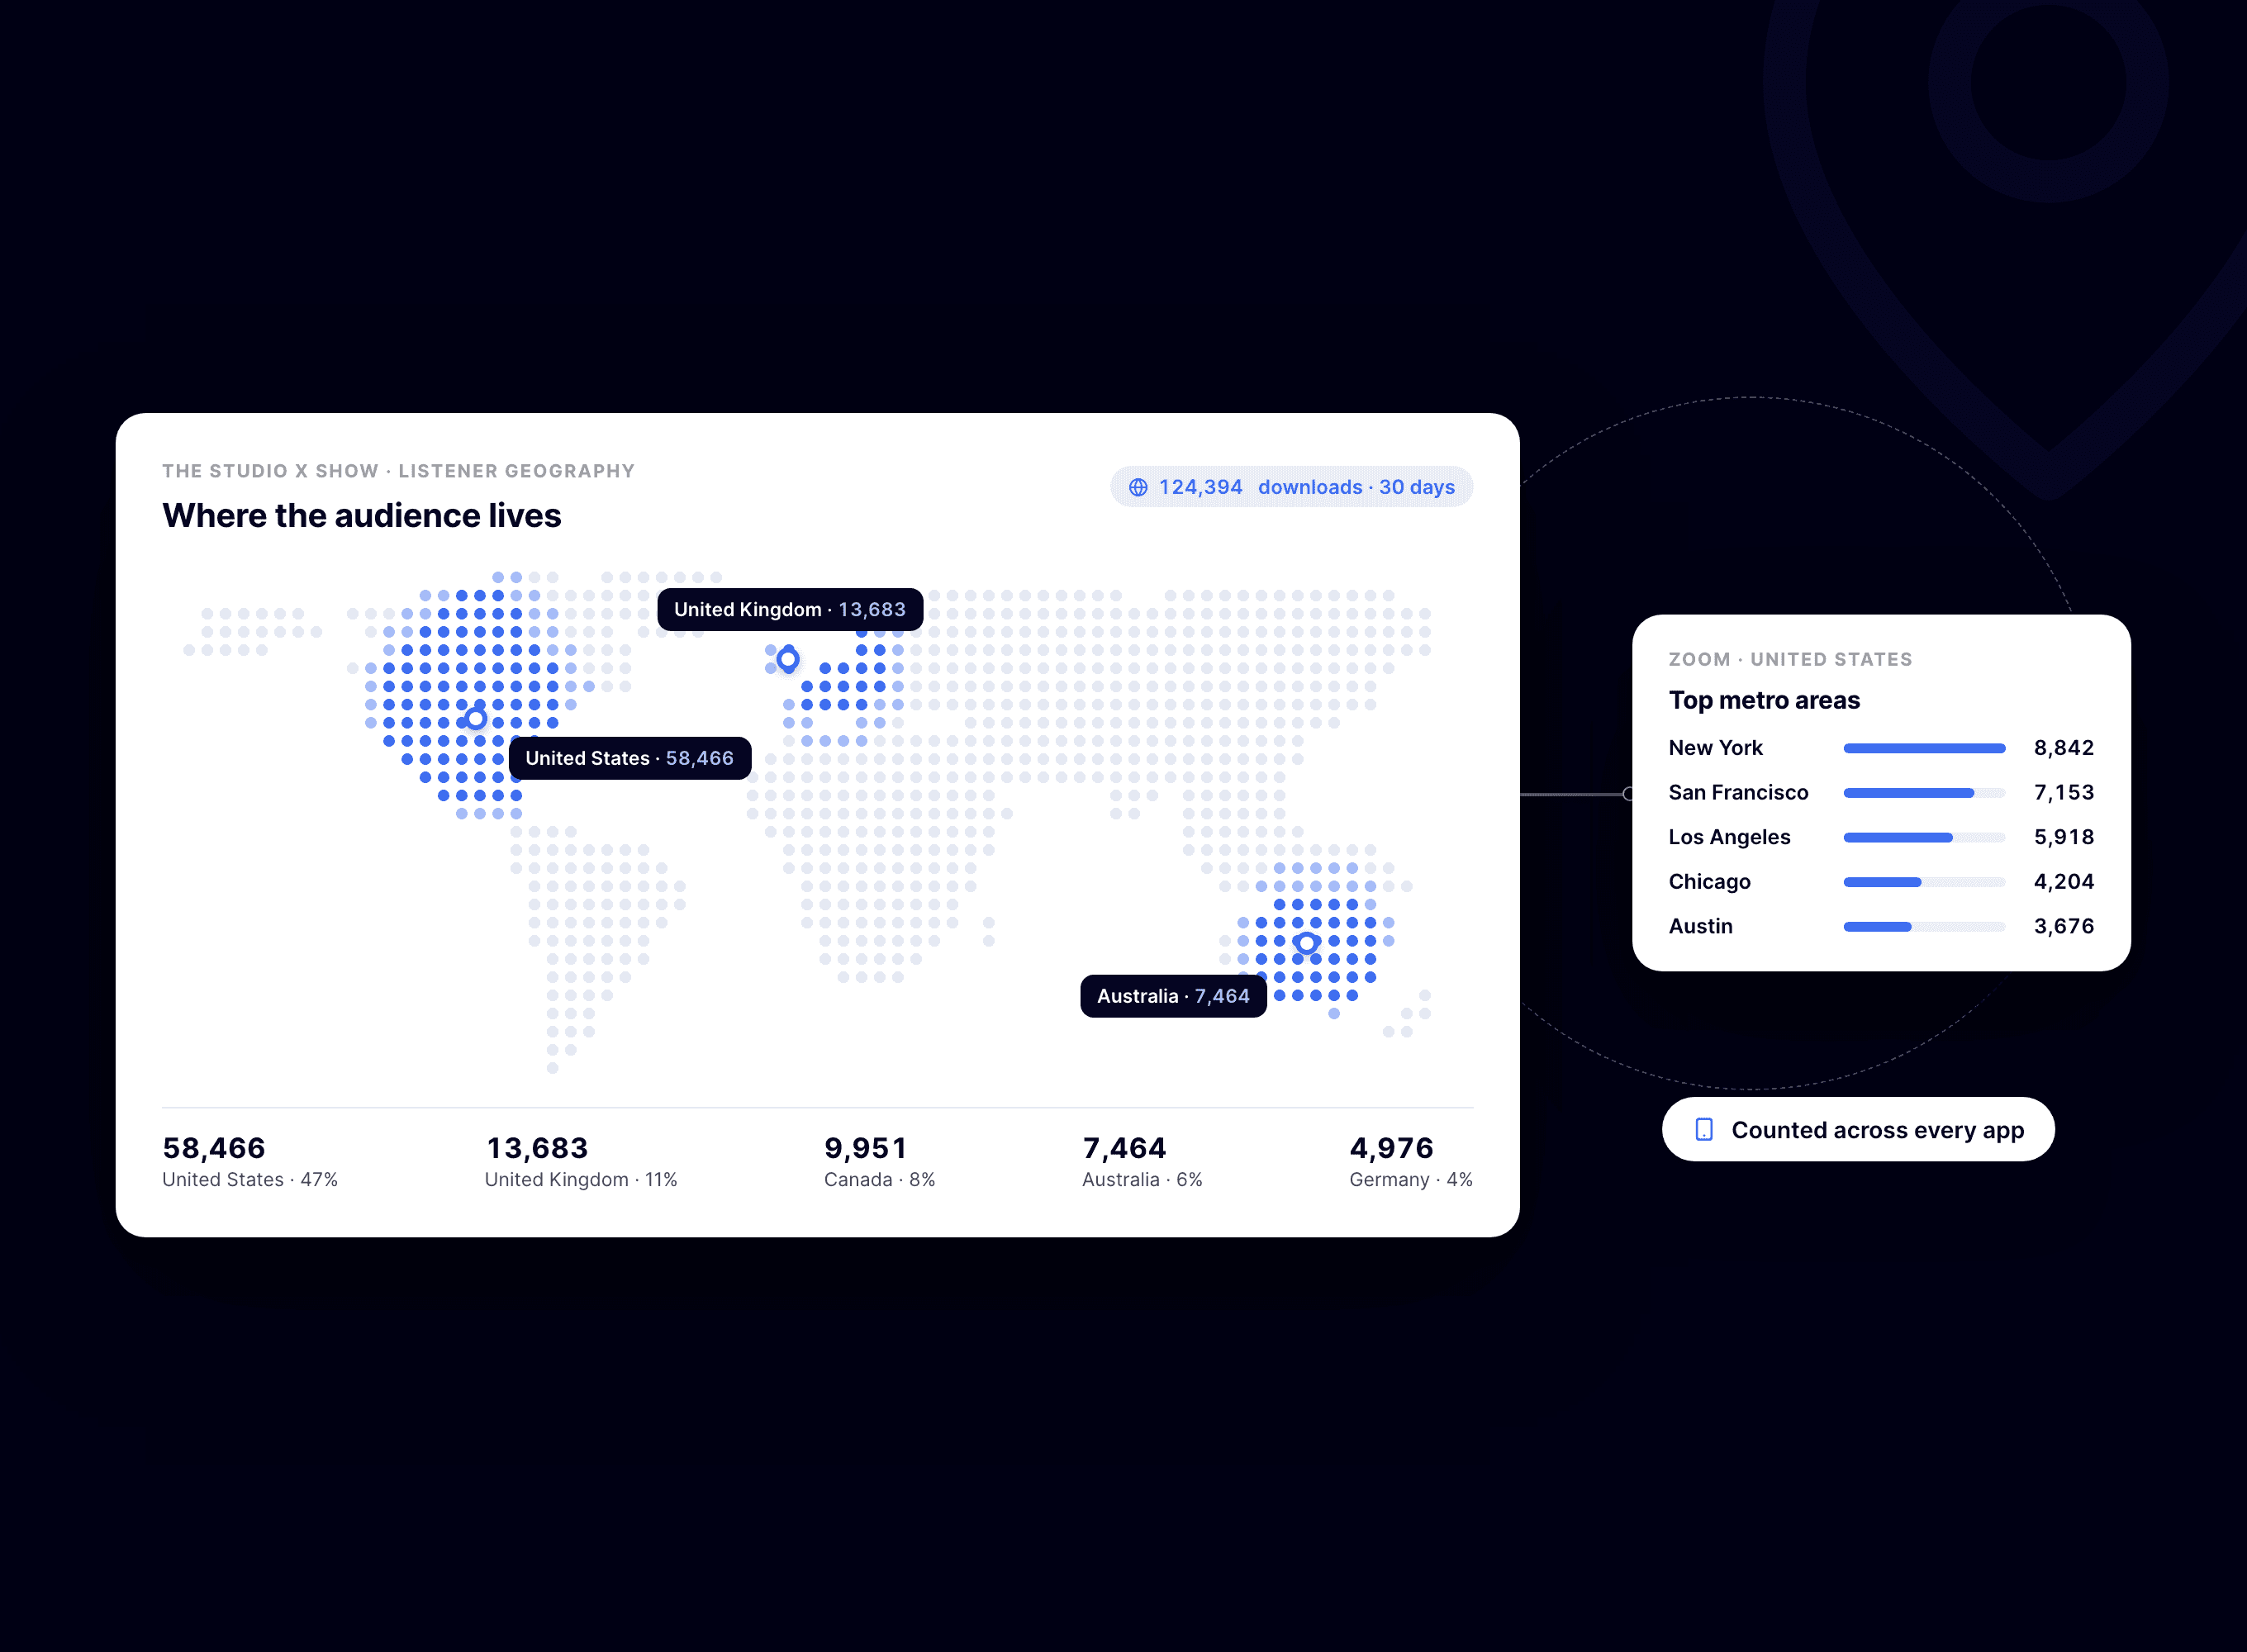
That gives you a real map of your audience: which countries listen, which US metros over-index, and how that mix shifts over time. It’s measured from actual behavior, not extrapolated from a survey panel.
Putting geography to work: content decisions
Once you can see where listeners are, content decisions get sharper:
A meaningful international audience means explaining region-specific references and skipping US-only assumptions
Strong metros are candidates for live shows, meetups, or local guest booking
A growing country you never targeted may deserve an episode aimed straight at it
Release timing can respect where your audience actually wakes up
Watch the map after topic changes, guest appearances, or press mentions — geographic shifts often reveal which channel actually brought the new listeners.
Putting geography to work: sponsor conversations
Sponsors care about one question: are your listeners the people they can sell to? Geography answers a big chunk of that honestly.
Lead with your download counts and country split — verifiable beats impressive
For US-focused sponsors, show the metro breakdown; over-indexing in their target cities is a selling point
For regional businesses, your listeners in their region matter more than your global total
Add your listening-app breakdown — it signals where promo codes and links will actually get seen
A smaller, verifiable, well-located audience closes deals that inflated guesswork can’t. Exporting the data to CSV and handing it over builds more trust than any deck slide.
The other honest demographic: apps and devices
How people listen is a demographic too. An audience heavy on Overcast and Pocket Casts skews toward podcast power-users; a Spotify-dominant audience behaves differently and discovers shows differently.
App and device breakdowns come straight from download data, so they carry the same reliability as geography — no panels, no modeling.
If you genuinely need age and income data for a sponsor, run a short listener survey and present it honestly as self-reported. Pair it with your verifiable geography and app numbers and you’ve got a sponsor page that holds up to scrutiny.
Conclusion
Chasing per-show age and gender data mostly leads to unverifiable estimates. Geography and listening apps are the demographics you can actually stand behind — and they’re enough to sharpen your content and win sponsor trust.
BuzzyPod’s OP3-powered dashboard puts your listener map — countries and US metros — alongside app breakdowns and CSV exports, for $10/month with a 14-day free trial.
Related reading
Introduction
Every sponsor deck template has a demographics slide, so every podcaster eventually goes hunting for podcast listener demographics — age, gender, income — and comes back mostly empty-handed. Here’s the uncomfortable truth: for most shows, that data barely exists.
Downloads don’t carry birthdays. What download data can tell you, reliably and without guesswork, is where your audience lives and which apps they use. That turns out to be more useful than podcasters expect.
This post covers what’s actually knowable, what’s survey-flavored guesswork, and how to put real geographic data to work.
Key takeaway
True age and gender data is mostly industry surveys or platform-siloed panels — not per-show facts
Spotify and Apple demographic data covers only their logged-in users, not your whole audience
Geography is different: it comes straight from download data and it’s reliable
Country and US-metro data drives real decisions on content, events, and sponsors
Listening-app breakdowns are the other demographic you can actually trust
Why age and gender data is mostly smoke
A podcast download is an anonymous file request. There’s no account, no profile, no age attached. So where do demographic claims come from?
Industry surveys — useful for “podcast listeners in general,” not your show specifically
Platform panels — Spotify knows its logged-in users’ profiles, but that describes only your Spotify slice
Listener surveys you run yourself — genuinely useful, but self-selected and small
Vendor estimates — often modeled from thin signals, and rarely auditable
None of this means demographic curiosity is pointless. It means any per-show age/gender number should be labeled clearly for what it is: an estimate from a partial sample. Sponsors who know the medium already understand this.
What download data actually knows: geography
Geography is the honest demographic. Download requests carry enough network information to place listeners by country — and in the US, by metro area — without profiling anyone.
That gives you a real map of your audience: which countries listen, which US metros over-index, and how that mix shifts over time. It’s measured from actual behavior, not extrapolated from a survey panel.
Putting geography to work: content decisions
Once you can see where listeners are, content decisions get sharper:
A meaningful international audience means explaining region-specific references and skipping US-only assumptions
Strong metros are candidates for live shows, meetups, or local guest booking
A growing country you never targeted may deserve an episode aimed straight at it
Release timing can respect where your audience actually wakes up
Watch the map after topic changes, guest appearances, or press mentions — geographic shifts often reveal which channel actually brought the new listeners.
Putting geography to work: sponsor conversations
Sponsors care about one question: are your listeners the people they can sell to? Geography answers a big chunk of that honestly.
Lead with your download counts and country split — verifiable beats impressive
For US-focused sponsors, show the metro breakdown; over-indexing in their target cities is a selling point
For regional businesses, your listeners in their region matter more than your global total
Add your listening-app breakdown — it signals where promo codes and links will actually get seen
A smaller, verifiable, well-located audience closes deals that inflated guesswork can’t. Exporting the data to CSV and handing it over builds more trust than any deck slide.
The other honest demographic: apps and devices
How people listen is a demographic too. An audience heavy on Overcast and Pocket Casts skews toward podcast power-users; a Spotify-dominant audience behaves differently and discovers shows differently.
App and device breakdowns come straight from download data, so they carry the same reliability as geography — no panels, no modeling.
If you genuinely need age and income data for a sponsor, run a short listener survey and present it honestly as self-reported. Pair it with your verifiable geography and app numbers and you’ve got a sponsor page that holds up to scrutiny.
Conclusion
Chasing per-show age and gender data mostly leads to unverifiable estimates. Geography and listening apps are the demographics you can actually stand behind — and they’re enough to sharpen your content and win sponsor trust.
BuzzyPod’s OP3-powered dashboard puts your listener map — countries and US metros — alongside app breakdowns and CSV exports, for $10/month with a 14-day free trial.
Related reading
Introduction
Every sponsor deck template has a demographics slide, so every podcaster eventually goes hunting for podcast listener demographics — age, gender, income — and comes back mostly empty-handed. Here’s the uncomfortable truth: for most shows, that data barely exists.
Downloads don’t carry birthdays. What download data can tell you, reliably and without guesswork, is where your audience lives and which apps they use. That turns out to be more useful than podcasters expect.
This post covers what’s actually knowable, what’s survey-flavored guesswork, and how to put real geographic data to work.
Key takeaway
True age and gender data is mostly industry surveys or platform-siloed panels — not per-show facts
Spotify and Apple demographic data covers only their logged-in users, not your whole audience
Geography is different: it comes straight from download data and it’s reliable
Country and US-metro data drives real decisions on content, events, and sponsors
Listening-app breakdowns are the other demographic you can actually trust
Why age and gender data is mostly smoke
A podcast download is an anonymous file request. There’s no account, no profile, no age attached. So where do demographic claims come from?
Industry surveys — useful for “podcast listeners in general,” not your show specifically
Platform panels — Spotify knows its logged-in users’ profiles, but that describes only your Spotify slice
Listener surveys you run yourself — genuinely useful, but self-selected and small
Vendor estimates — often modeled from thin signals, and rarely auditable
None of this means demographic curiosity is pointless. It means any per-show age/gender number should be labeled clearly for what it is: an estimate from a partial sample. Sponsors who know the medium already understand this.
What download data actually knows: geography
Geography is the honest demographic. Download requests carry enough network information to place listeners by country — and in the US, by metro area — without profiling anyone.
That gives you a real map of your audience: which countries listen, which US metros over-index, and how that mix shifts over time. It’s measured from actual behavior, not extrapolated from a survey panel.
Putting geography to work: content decisions
Once you can see where listeners are, content decisions get sharper:
A meaningful international audience means explaining region-specific references and skipping US-only assumptions
Strong metros are candidates for live shows, meetups, or local guest booking
A growing country you never targeted may deserve an episode aimed straight at it
Release timing can respect where your audience actually wakes up
Watch the map after topic changes, guest appearances, or press mentions — geographic shifts often reveal which channel actually brought the new listeners.
Putting geography to work: sponsor conversations
Sponsors care about one question: are your listeners the people they can sell to? Geography answers a big chunk of that honestly.
Lead with your download counts and country split — verifiable beats impressive
For US-focused sponsors, show the metro breakdown; over-indexing in their target cities is a selling point
For regional businesses, your listeners in their region matter more than your global total
Add your listening-app breakdown — it signals where promo codes and links will actually get seen
A smaller, verifiable, well-located audience closes deals that inflated guesswork can’t. Exporting the data to CSV and handing it over builds more trust than any deck slide.
The other honest demographic: apps and devices
How people listen is a demographic too. An audience heavy on Overcast and Pocket Casts skews toward podcast power-users; a Spotify-dominant audience behaves differently and discovers shows differently.
App and device breakdowns come straight from download data, so they carry the same reliability as geography — no panels, no modeling.
If you genuinely need age and income data for a sponsor, run a short listener survey and present it honestly as self-reported. Pair it with your verifiable geography and app numbers and you’ve got a sponsor page that holds up to scrutiny.
Conclusion
Chasing per-show age and gender data mostly leads to unverifiable estimates. Geography and listening apps are the demographics you can actually stand behind — and they’re enough to sharpen your content and win sponsor trust.
BuzzyPod’s OP3-powered dashboard puts your listener map — countries and US metros — alongside app breakdowns and CSV exports, for $10/month with a 14-day free trial.

